IPv6 deployment continues to grow, but progress is not in a straight line. The rate of growth depends on what you measure, and from where. Skip to the end to see predictions about the future.
Users
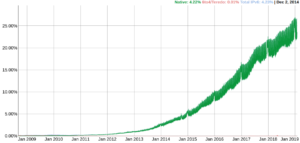
Maybe because they were the first, people most often cite Google’s numbers. This chart is the percentage of hits on Google properties over IPv6. It does reveal some interesting trends:
- The shaggy line is the difference between weekday and weekend patterns. Weekends are higher, because enterprises have been slow to adopt IPv6 so far, while residential and mobile ISPs have been more aggressive.
- There’s always a spike around the new year, reflecting the same pattern (as people have a holiday).
- The first few months of the year are usually slow. Large network operators stop maintenance work for the end of year holidays, because any change might have an unintended consequence somewhere. When January comes, they have to dig out of a backlog of change orders. In April it starts to pick up again.
- Growth may have slowed a bit in late 2017, but it’s hard to tell.
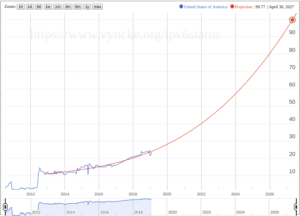
To take a closer look, I really like Eric Vyncke’s visualization, because he includes a tool to run projections:
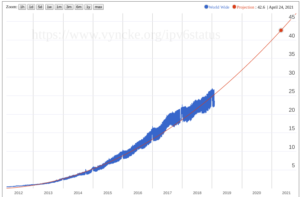
This example is again using Google’s global numbers, but he’s added a red trendline (in this case a quadratic regression). Maybe deployment hasn’t slowed, it’s just returned to normal after a surge in deployment in late 2016, and again mid 2017. My favorite thing to do on that site is to choose the logistic curve, since technology adoption usually follows such a curve (slow start, rapid growth, long tail: an S curve).
Eric also makes it possible to select any country to see its progress, and to choose from among different data sources. Not all sources provide the same data, so while we can’t see a World Wide view from Akamai’s data, we can see a linear extrapolation for, say, India:
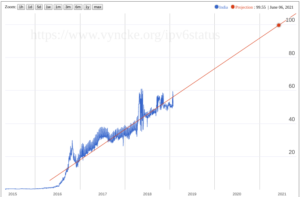
Definitely a good news story from a huge country! Akamai does provide its data publicly, sortable by country and by network. It would be possible to expand each country’s data, then weight them by population (further adjusted for Internet penetration?), to figure out a global number. A lot of work when we have other sources that are pretty much in line. Some highlights are that 54% of hits on Akamai in India use IPv6, 46.6% in Belgium, 45.9% in the U.S., 39.4% in Germany, and so on.
Facebook gives us another nice graphic showing IPv6 deployment:
Facebook’s measurements come out a little higher than Akamai, with over 55% of the U.S., 56% in India, 62% in Belgium, and 50% in Germany. I’d guess Facebook users are slightly higher on the technology curve than Akamai.
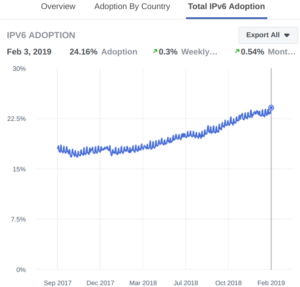
Finally, APNIC provides up to date active measurements:
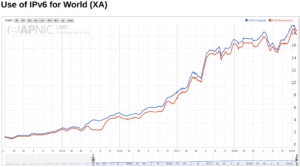
Slightly lower than others, but similar rates.
Content
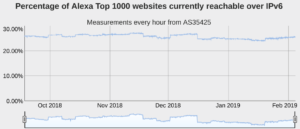
The goal of deploying IPv6 is to escape the need for IPv4. In order for that to happen, content has to be available over IPv6. Dan Wing has been measuring web sites for IPv6 capability longer than anybody:
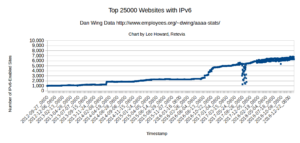
There are some anomalies in this chart: the waterfall in the fall of 2017, and some shagginess since early 2018; both are artifactts of data collection, and I’d guess his measuring tool has had some connectivity issues. You can see two sudden bumps where CloudFlare suddenly turned on IPv6 for many of their customers, then nearly all of their customers. It’s a sign of how low risk it is, since they just turned it on. The linear growth since then reflects the fact that CloudFlare and Akamai automatically enable dual-stack for all new customers. I wrote a while back about how much impact various CDNs would make if they followed CloudFlare’s example.
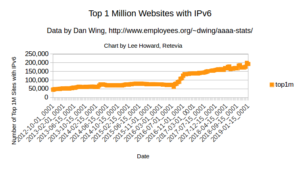
Dan’s list of the top one million sites (same page, run every two weeks) shows much the same progression:
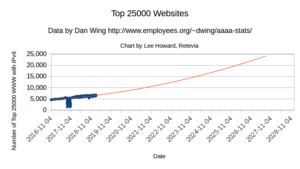
Based on the current rate of growth, using Dan’s numbers, every web site that matters (top 25,000) should have IPv6 in about 8 years.
Again, Eric doesn’t have global data like Dan, but we can extrapolate from the last big bump in the U.S. to find a trend of all web sites in the U.S. having IPv6 in 8 years.
The group that held the World IPv6 Launch collaborates on measurement, and one of them provides a chart measuring content.
Now, IPv4 is likely to continue to be in use in pockets of data centers, or even in some parts of the Internet, for a while. All of these measurements are Internet access and web, and there are many other devices and protocols on the Internet. It’s reasonable, though, to think that by the time all web traffic is using IPv6, people will be unwilling to pay for IPv4.
Summary
In summary, every metric shows that the majority of Internet connections will be over IPv6 in three years, and the transition is complete in 7-8 years:
| 50% | 80% | 100% | |
| Wing web sites | 2022 | 2026 | 2027 |
| Vyncke web sites (US top 50) | 2022 | 2025 | 2026 |
| Google users (worldwide) | 2022 | 2024 | 2026 |
| APNIC users | 2022 | 2024 | 2026 |
If you or your company needs help getting ready for this transition in time, Retevia can help.
Lee Howard @wleecoyote
Retevia @ReteviaIPv6
5 February 2019
2 thoughts on “IPv6 Growth”
Comments are closed.